Thirty-two threads, one instruction
A ground-up introduction to CUDA for programmers who have never written a kernel, where every number was measured on a real GPU.
The first CUDA program I ever benchmarked spent more than 98% of its wall-clock time not running on the GPU. The kernel itself was fine. It was everything around it — copying data in, copying data out — that ate the clock. That one measurement taught me more about GPUs than any diagram of streaming multiprocessors ever had, and it’s a good place to start this post.
What follows is the introduction to CUDA I wish I’d had: the programming model, a first kernel, and then four small experiments — vector addition, reduction, matrix multiplication and kernel fusion — that each teach one idea about how GPUs actually spend their time. All of the code comes from my lab notebooks (kernel-labs-cuda, systems-under-load and paper-kernel), and every number was measured, not estimated.
Why a GPU at all
A CPU is built to make one thread go fast. Most of its silicon is spent on things that aren’t arithmetic: branch predictors, out-of-order execution machinery, and large caches that hide memory latency. A GPU makes the opposite bet. It strips each core down to almost nothing and spends the transistors on more of them.
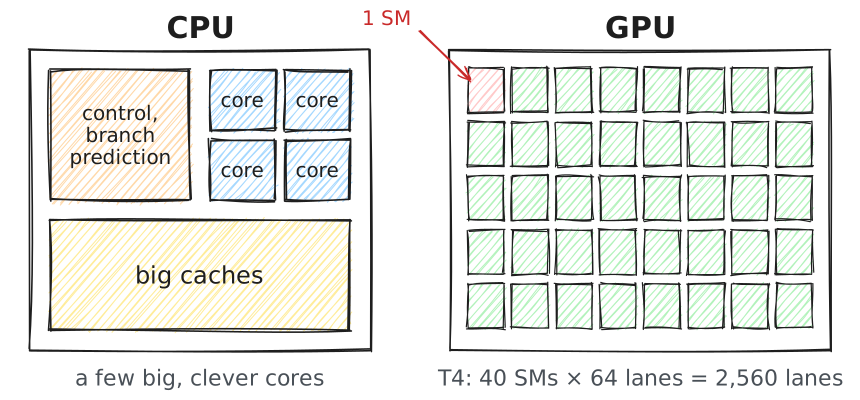
The consequence is that a GPU doesn’t hide memory latency by being clever — it hides it by having so much other work in flight that, while one group of threads waits for memory, another group is ready to compute. That only works if you give it a lot of parallel work. A GPU running a hundred threads is a very expensive, very slow CPU.
The programming model
CUDA asks you to write one function, the kernel, from the point of view of a single thread. You then launch it across thousands of threads at once, organised in a two-level hierarchy:
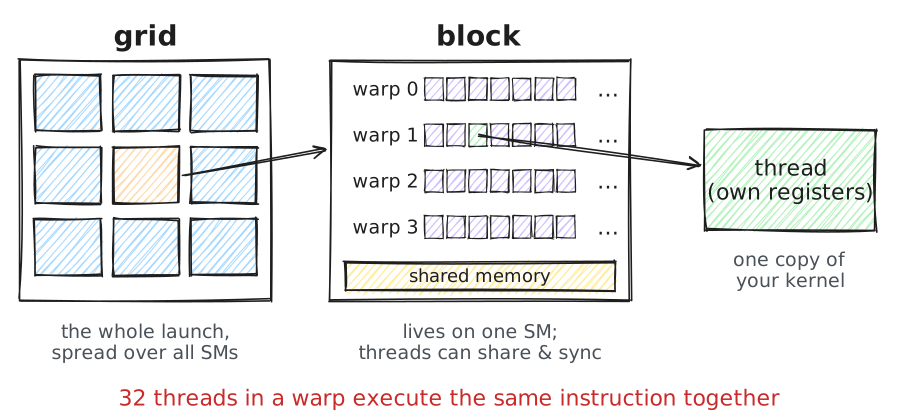
- A thread runs your kernel once. It has its own registers and its own index.
- A block is a group of up to 1,024 threads that are guaranteed to run on the same SM. Threads in a block can share a small, fast scratchpad (shared memory) and wait for each other with
__syncthreads(). - A grid is all the blocks in a launch. Blocks are independent; the GPU runs them in whatever order it likes, on whichever SMs are free.
- A warp is the hardware’s unit of execution: 32 consecutive threads in a block that issue the same instruction at the same time. You don’t declare warps, but you can’t write fast code without thinking about them.
Every thread can ask where it is through a handful of built-in variables:
| Variable | Meaning | Typical use |
|---|---|---|
threadIdx | this thread’s index within its block (x, y, z) | which element within the tile |
blockIdx | this block’s index within the grid | which tile of the problem |
blockDim | threads per block | stride between blocks |
gridDim | blocks in the grid | grid-stride loops |
warpSize | always 32 on NVIDIA hardware | warp-level tricks |
For a one-dimensional problem, the global index of a thread is
and that line appears, in some form, in nearly every kernel ever written.
A first kernel: adding two vectors
Here’s the whole thing — the kernel from my first lab, plus the host code that drives it:
__global__ void vectorAdd(const float* a, const float* b, float* c, int n) {
    int i = blockIdx.x * blockDim.x + threadIdx.x;
    if (i < n) {            // the last block may hang off the end
        c[i] = a[i] + b[i];
    }
}

int main() {
    const int n = 1 << 30;                  // ~1 billion floats
    const size_t bytes = size_t(n) * sizeof(float);
    std::vector<float> h_a(n, 1.0f), h_b(n, 2.0f), h_c(n);

    float *d_a, *d_b, *d_c;
    // 1. allocate on the device
    CHECK_CUDA(cudaMalloc(&d_a, bytes));
    CHECK_CUDA(cudaMalloc(&d_b, bytes));
    CHECK_CUDA(cudaMalloc(&d_c, bytes));

    // 2. copy the inputs in
    CHECK_CUDA(cudaMemcpy(d_a, h_a.data(), bytes, cudaMemcpyHostToDevice));
    CHECK_CUDA(cudaMemcpy(d_b, h_b.data(), bytes, cudaMemcpyHostToDevice));

    // 3. launch: round the grid up so every element is covered
    int block = 256;
    int grid  = (n + block - 1) / block;
    vectorAdd<<<grid, block>>>(d_a, d_b, d_c, n);
    CHECK_CUDA(cudaGetLastError());

    // 4. copy the result out
    CHECK_CUDA(cudaMemcpy(h_c.data(), d_c, bytes, cudaMemcpyDeviceToHost));
}
Three things to notice. __global__ marks a function that runs on the GPU but is called from the CPU. The triple-chevron <<<grid, block>>> syntax is the launch configuration: how many blocks, and how many threads in each. And the if (i < n) guard matters, because the grid is rounded up to a whole number of blocks, so the last few threads have nothing to do.
CHECK_CUDA is a three-line macro that turns a returned error code into a crash with a file and line number. Use it on every call. CUDA errors are sticky and asynchronous: a bad launch often doesn’t complain until some unrelated call several lines later.
Lesson one: the PCIe tax
The GPU can’t read your program’s memory directly. Data has to cross the PCIe bus into the card’s own VRAM, the kernel runs there, and the result has to cross back.
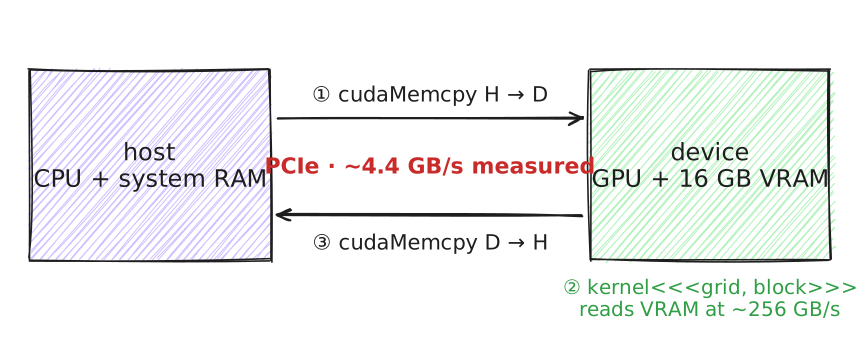
I timed each of the three phases separately with CUDA events, across five problem sizes. Times are in milliseconds, medians across block sizes of 64–512:
| Elements | H→D copy | Kernel | D→H copy | Kernel share | Kernel GB/s |
|---|---|---|---|---|---|
| 2¹⁰ | 0.019 | 0.010 | 0.015 | 23.8% | 1.2 |
| 2¹⁶ | 0.231 | 0.014 | 0.117 | 4.0% | 54.8 |
| 2²⁰ | 4.464 | 0.063 | 1.200 | 1.1% | 198.6 |
| 2²⁴ | 31.328 | 0.793 | 15.499 | 1.7% | 253.9 |
| 2³⁰ | 1,927.89 | 50.274 | 1,049.65 | 1.7% | 256.3 |
At a billion elements, the kernel took 50 ms; moving the data took almost three seconds. The kernel itself, meanwhile, is doing great: it moves bytes per element (two reads, one write), so at elements it streams 12.9 GB through memory in 50 ms. That’s 256 GB/s, about 80% of what the T4’s memory can physically deliver.
The left side of that curve is the other half of the lesson. With 1,024 elements, the kernel finishes in about ten microseconds no matter what it does — that’s the fixed cost of launching anything at all. A GPU needs millions of elements before it stops being bored.
Lesson two: how a warp reads memory
Vector add reached 80% of peak bandwidth almost by accident, and the reason is worth understanding. When a warp executes a load, the hardware looks at all 32 addresses together and fetches the 32-byte memory segments that contain them. If neighbouring threads read neighbouring addresses, those requests collapse into a few wide transactions. This is called coalescing.
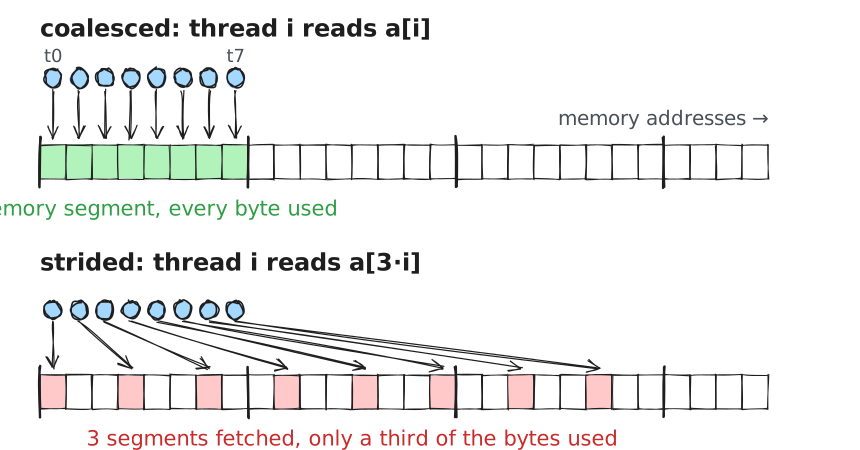
In vectorAdd, thread reads a[i], so a warp reads 32 consecutive floats: four perfectly used segments. Flip the indexing so each thread walks down a column of a row-major matrix, and the same instruction suddenly fetches 32 different segments, using 4 bytes out of each 32. Same arithmetic, an eighth of the useful bandwidth.
My notes from that session put it bluntly: coalescing means combining many small memory accesses into one big memory transaction. Almost every optimisation in the rest of this post is a way of arranging for that to happen.
Lesson three: making threads cooperate
Adding two vectors is “embarrassingly parallel”: no thread needs anything from any other. Summing a vector is not. Every element has to end up in a single number, so threads have to combine their work. The standard approach is a tree reduction inside each block, in shared memory, followed by a final sum over the per-block results.
There are two obvious ways to draw that tree, and they perform very differently:
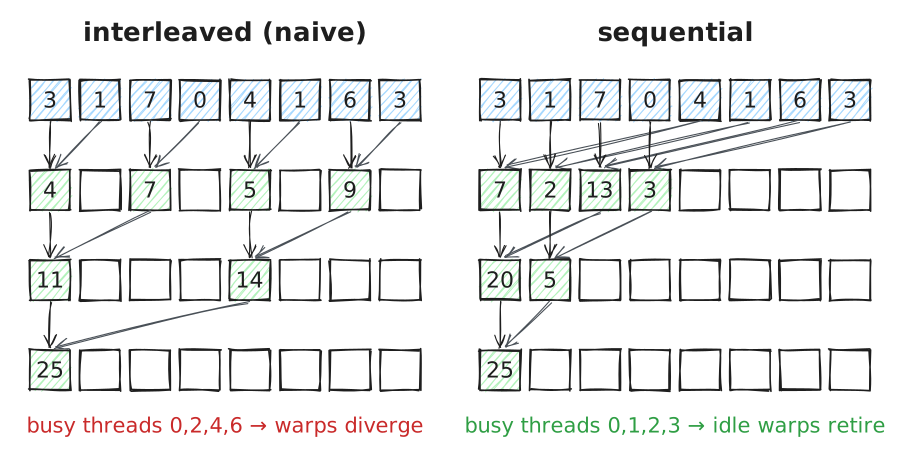
My first version used interleaved addressing: at step , thread is active if is a multiple of .
for (unsigned int stride = 1; stride < blockDim.x; stride *= 2) {
    // active: every 2nd thread, then every 4th, then every 8th…
    if ((tid % (2 * stride)) == 0) {
        sdata[tid] += sdata[tid + stride];
    }
    __syncthreads();
}
The problem is warp divergence. In the first step, half the threads in every warp are active, so every warp has to execute the instruction while half its lanes sit masked off. The % operator doesn’t help either; integer modulo is slow on a GPU.
The fix is to flip the tree so the active threads are contiguous — sequential addressing:
for (unsigned int stride = blockDim.x / 2; stride > 0; stride >>= 1) {
    // active: threads 0 .. stride-1, packed together
    if (tid < stride) {
        sdata[tid] += sdata[tid + stride];
    }
    __syncthreads();
}
Now, at each step, the active threads fill whole warps and the inactive ones form whole warps that simply retire. The third version goes further: each thread adds two elements while loading from global memory (halving the number of blocks), and once only 32 threads remain, it stops calling __syncthreads() because a single warp is already in lockstep:
__device__ void warp_reduce(volatile float* sdata, unsigned int tid) {
    sdata[tid] += sdata[tid + 32];
    sdata[tid] += sdata[tid + 16];
    sdata[tid] += sdata[tid + 8];
    sdata[tid] += sdata[tid + 4];
    sdata[tid] += sdata[tid + 2];
    sdata[tid] += sdata[tid + 1];
}
Here’s how the three compare on floats, swept across block sizes:
- Two loads + warp unroll
- Sequential
- Interleaved
| Kernel | Best block | Time (ms) | Elements/s | % of peak BW |
|---|---|---|---|---|
| Interleaved (naive) | 64 | 1.476 | 11.4 G | 14% |
| Sequential addressing | 128 | 1.112 | 15.1 G | 19% |
| Two loads + warp unroll | 128 | 0.454 | 37.0 G | 46% |
A reduction does one addition per four bytes loaded, so it’s entirely memory-bound; the only question is how close to 320 GB/s you can get. The best version reaches 46%, against vector add’s 80%. The remaining gap comes from each thread doing too little work. The usual next steps are a grid-stride loop so each thread sums many elements before touching shared memory, float4 vectorised loads, and replacing the shared-memory warp stage with __shfl_down_sync, which passes values between registers directly.
Lesson four: reuse is everything
Matrix multiplication is the opposite of a reduction. For with matrices, there are floating-point operations but only numbers. In principle every number loaded from memory can be reused times. Whether a GEMM is fast is almost entirely a question of how much of that reuse you capture.
The naive kernel gives each thread one output element and lets it walk the whole dot product by itself:
__global__ void sgemm_naive(int M, int N, int K,
                            const float *A, const float *B, float *C) {
    const uint row = blockIdx.x * blockDim.x + threadIdx.x;
    const uint col = blockIdx.y * blockDim.y + threadIdx.y;
    if (row < M && col < N) {
        float acc = 0.0f;
        for (int k = 0; k < K; ++k)
            acc += A[row * K + k] * B[k * N + col];  // both from VRAM
        C[row * N + col] = acc;
    }
}
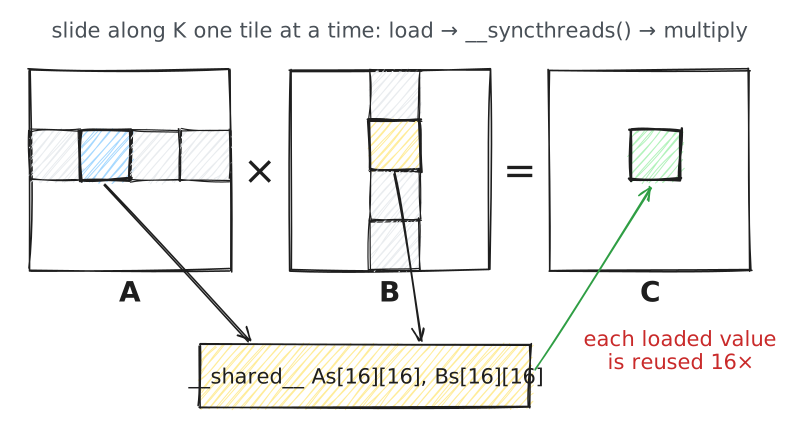
Each thread loads values to do FLOPs. The caches rescue some of that, but the kernel still treats VRAM as if it were free. The fix is shared-memory tiling: a block of threads cooperatively loads a tile of and one of into shared memory, synchronises, and then every thread reads its operands from the fast on-chip copy.
template <const int TILE>
__global__ void sgemm_shared(int M, int N, int K,
                             const float *A, const float *B, float *C) {
    __shared__ float As[TILE * TILE];
    __shared__ float Bs[TILE * TILE];

    const uint tRow = threadIdx.x / TILE, tCol = threadIdx.x % TILE;
    // point A, B and C at this block's row panel, column panel and output tile
    A += blockIdx.x * TILE * K;
    B += blockIdx.y * TILE;
    C += blockIdx.x * TILE * N + blockIdx.y * TILE;

    float acc = 0.0f;
    for (int k0 = 0; k0 < K; k0 += TILE) {
        // each thread loads one element of each tile
        As[tRow * TILE + tCol] = A[tRow * K + tCol];
        Bs[tRow * TILE + tCol] = B[tRow * N + tCol];
        __syncthreads();  // wait until both tiles are complete

        A += TILE;
        B += TILE * N;
        for (int k = 0; k < TILE; ++k)
            acc += As[tRow * TILE + k] * Bs[k * TILE + tCol];
        __syncthreads();  // don't overwrite tiles still in use
    }
    C[tRow * N + tCol] = acc;
}
Two __syncthreads() calls per step, and both are load-bearing: the first makes sure nobody reads a half-loaded tile, the second makes sure nobody overwrites a tile someone else is still reading. Forgetting either one doesn’t crash — it silently gives you almost the right answer, which is much worse.
Here’s how the versions compare on a FP32 GEMM:
| Implementation | Time (ms) | GFLOP/s | vs. cuBLAS |
|---|---|---|---|
| Naive (Triton) | 49.982 | 43 | 60× slower |
| Naive (CUDA) | 5.705 | 376 | 6.9× slower |
| Tiled 16×16 (CUDA) | 2.478* | 867 | 3.0× slower |
| cuBLAS via PyTorch | 0.828 | 2,594 | — |
* The tiled timing comes from my kernel-fusion experiment below, and includes a fused bias-add and ReLU, which cost almost nothing next to the GEMM.
The Triton result is the surprise. Triton is a fantastic tool, but my naive Triton kernel launched one program per output element — a million tiny programs, each computing a single dot product — and Triton can’t fix a bad decomposition for you. A proper Triton GEMM assigns each program a whole output tile and uses tl.dot, at which point it’s competitive with cuBLAS.
Seeing it all on one chart
There’s a single picture that explains every result above. For any kernel, compute its arithmetic intensity : FLOPs performed per byte moved from VRAM. With peak compute and memory bandwidth , a GPU can deliver at most
On the T4, that’s . The two terms are equal at FLOP/byte, the ridge point. Below it you’re memory-bound, and the only way to go faster is to move fewer bytes. Above it you’re compute-bound.
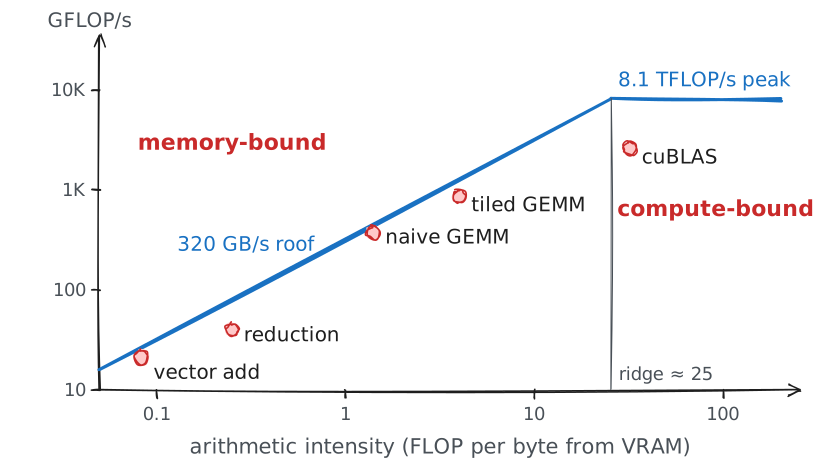
Vector add does 1 FLOP per 12 bytes (); no amount of cleverness will ever make it compute-bound, so the goal is just to saturate bandwidth. A shared-memory tile raises GEMM’s intensity to roughly FLOP/byte in FP32 — about 4 for — which is why tiling helps, and why serious GEMMs use much larger tiles plus a second level of blocking in registers.
Lesson five: the fastest byte is the one you never write
The last experiment comes from reproducing a kernel-fusion idea from a recent paper. A neural-network layer rarely ends at the matrix multiply: there’s usually a bias add and an activation afterwards. The straightforward implementation launches three kernels, and each one writes its full output to VRAM for the next one to read back.
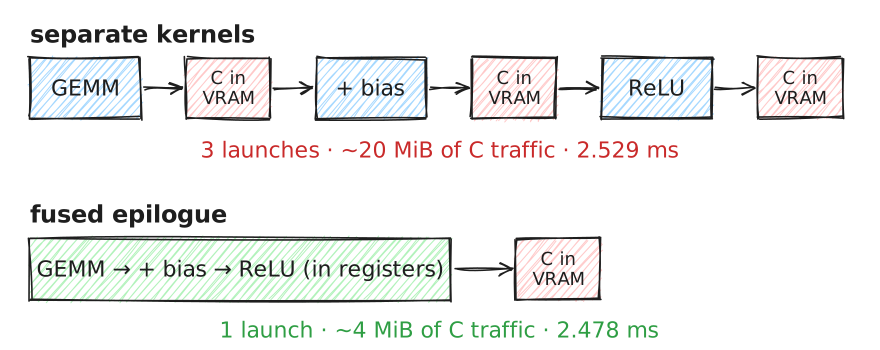
The fused version applies the bias and ReLU to the accumulator while it’s still in a register, then writes exactly once. Same tiled GEMM main loop in both versions, timed over 100 runs after warm-up:
- Separate kernels
- Fused epilogue
A 2% improvement doesn’t sound like much — until you check it against the roofline. The separate path does one GEMM write plus two read-modify-write passes over the 4 MiB output, about 20 MiB in total; the fused path writes 4 MiB. The difference is 16 MiB, and at 320 GB/s, moving 16 MiB takes
The measured saving was 51 µs. That’s the whole improvement, explained to the microsecond by bytes not moved. Here the GEMM dominates, so the win is small; in memory-bound parts of a network (normalisation layers, activations, residual adds) the same trick often cuts runtime by half or more, because there almost all of the time is memory traffic.
A beginner’s checklist
When a kernel is slow, these are the questions I now ask, in order:
| Symptom | Likely cause | First thing to try |
|---|---|---|
cudaMemcpy dominates the profile | Data crossing PCIe every iteration | Keep tensors resident in VRAM; batch the copies |
| Runtime flat no matter the size | Launch overhead (~10 µs each) | Do more work per launch; fuse kernels |
| Elementwise kernel far below peak | Uncoalesced or strided access | Make threadIdx.x index the contiguous dimension |
| Reduction far below peak bandwidth | Divergent warps; too little work per thread | Sequential addressing, grid-stride loops, shuffles |
| GEMM stuck below 1 TFLOP/s | No data reuse | Shared-memory tiling, then register blocking |
| Many small kernels in a row | Intermediates round-tripping through VRAM | Fuse the epilogue into the producing kernel |
Where to go next
Everything here is the foundation, not the frontier. The next rungs on the ladder are register blocking (each thread computes a small tile of outputs, not one), vectorised float4 loads, warp-level tiling, and finally Tensor Cores, which do a matrix multiply as a single warp-wide operation. Those are the steps I’m working through now in systems-under-load, on the way to FlashAttention and mixture-of-experts kernels.
But the core idea never changes. A GPU is a machine with an absurd amount of arithmetic attached to a comparatively narrow pipe to memory. Almost all of CUDA performance work is figuring out how to send fewer bytes down that pipe, and how to keep thirty-two threads at a time all doing the same useful thing.